Retail Sales & Returns Dashboard
A comprehensive analysis of sales performance, return trends, and customer behavior.
Project Overview
This Power BI solution provides a holistic view of retail performance, focusing on the critical balance between sales growth and return rates. By integrating transactional data with customer demographics, the dashboard enables stakeholders to identify high-value segments and operational bottlenecks.
Key Features
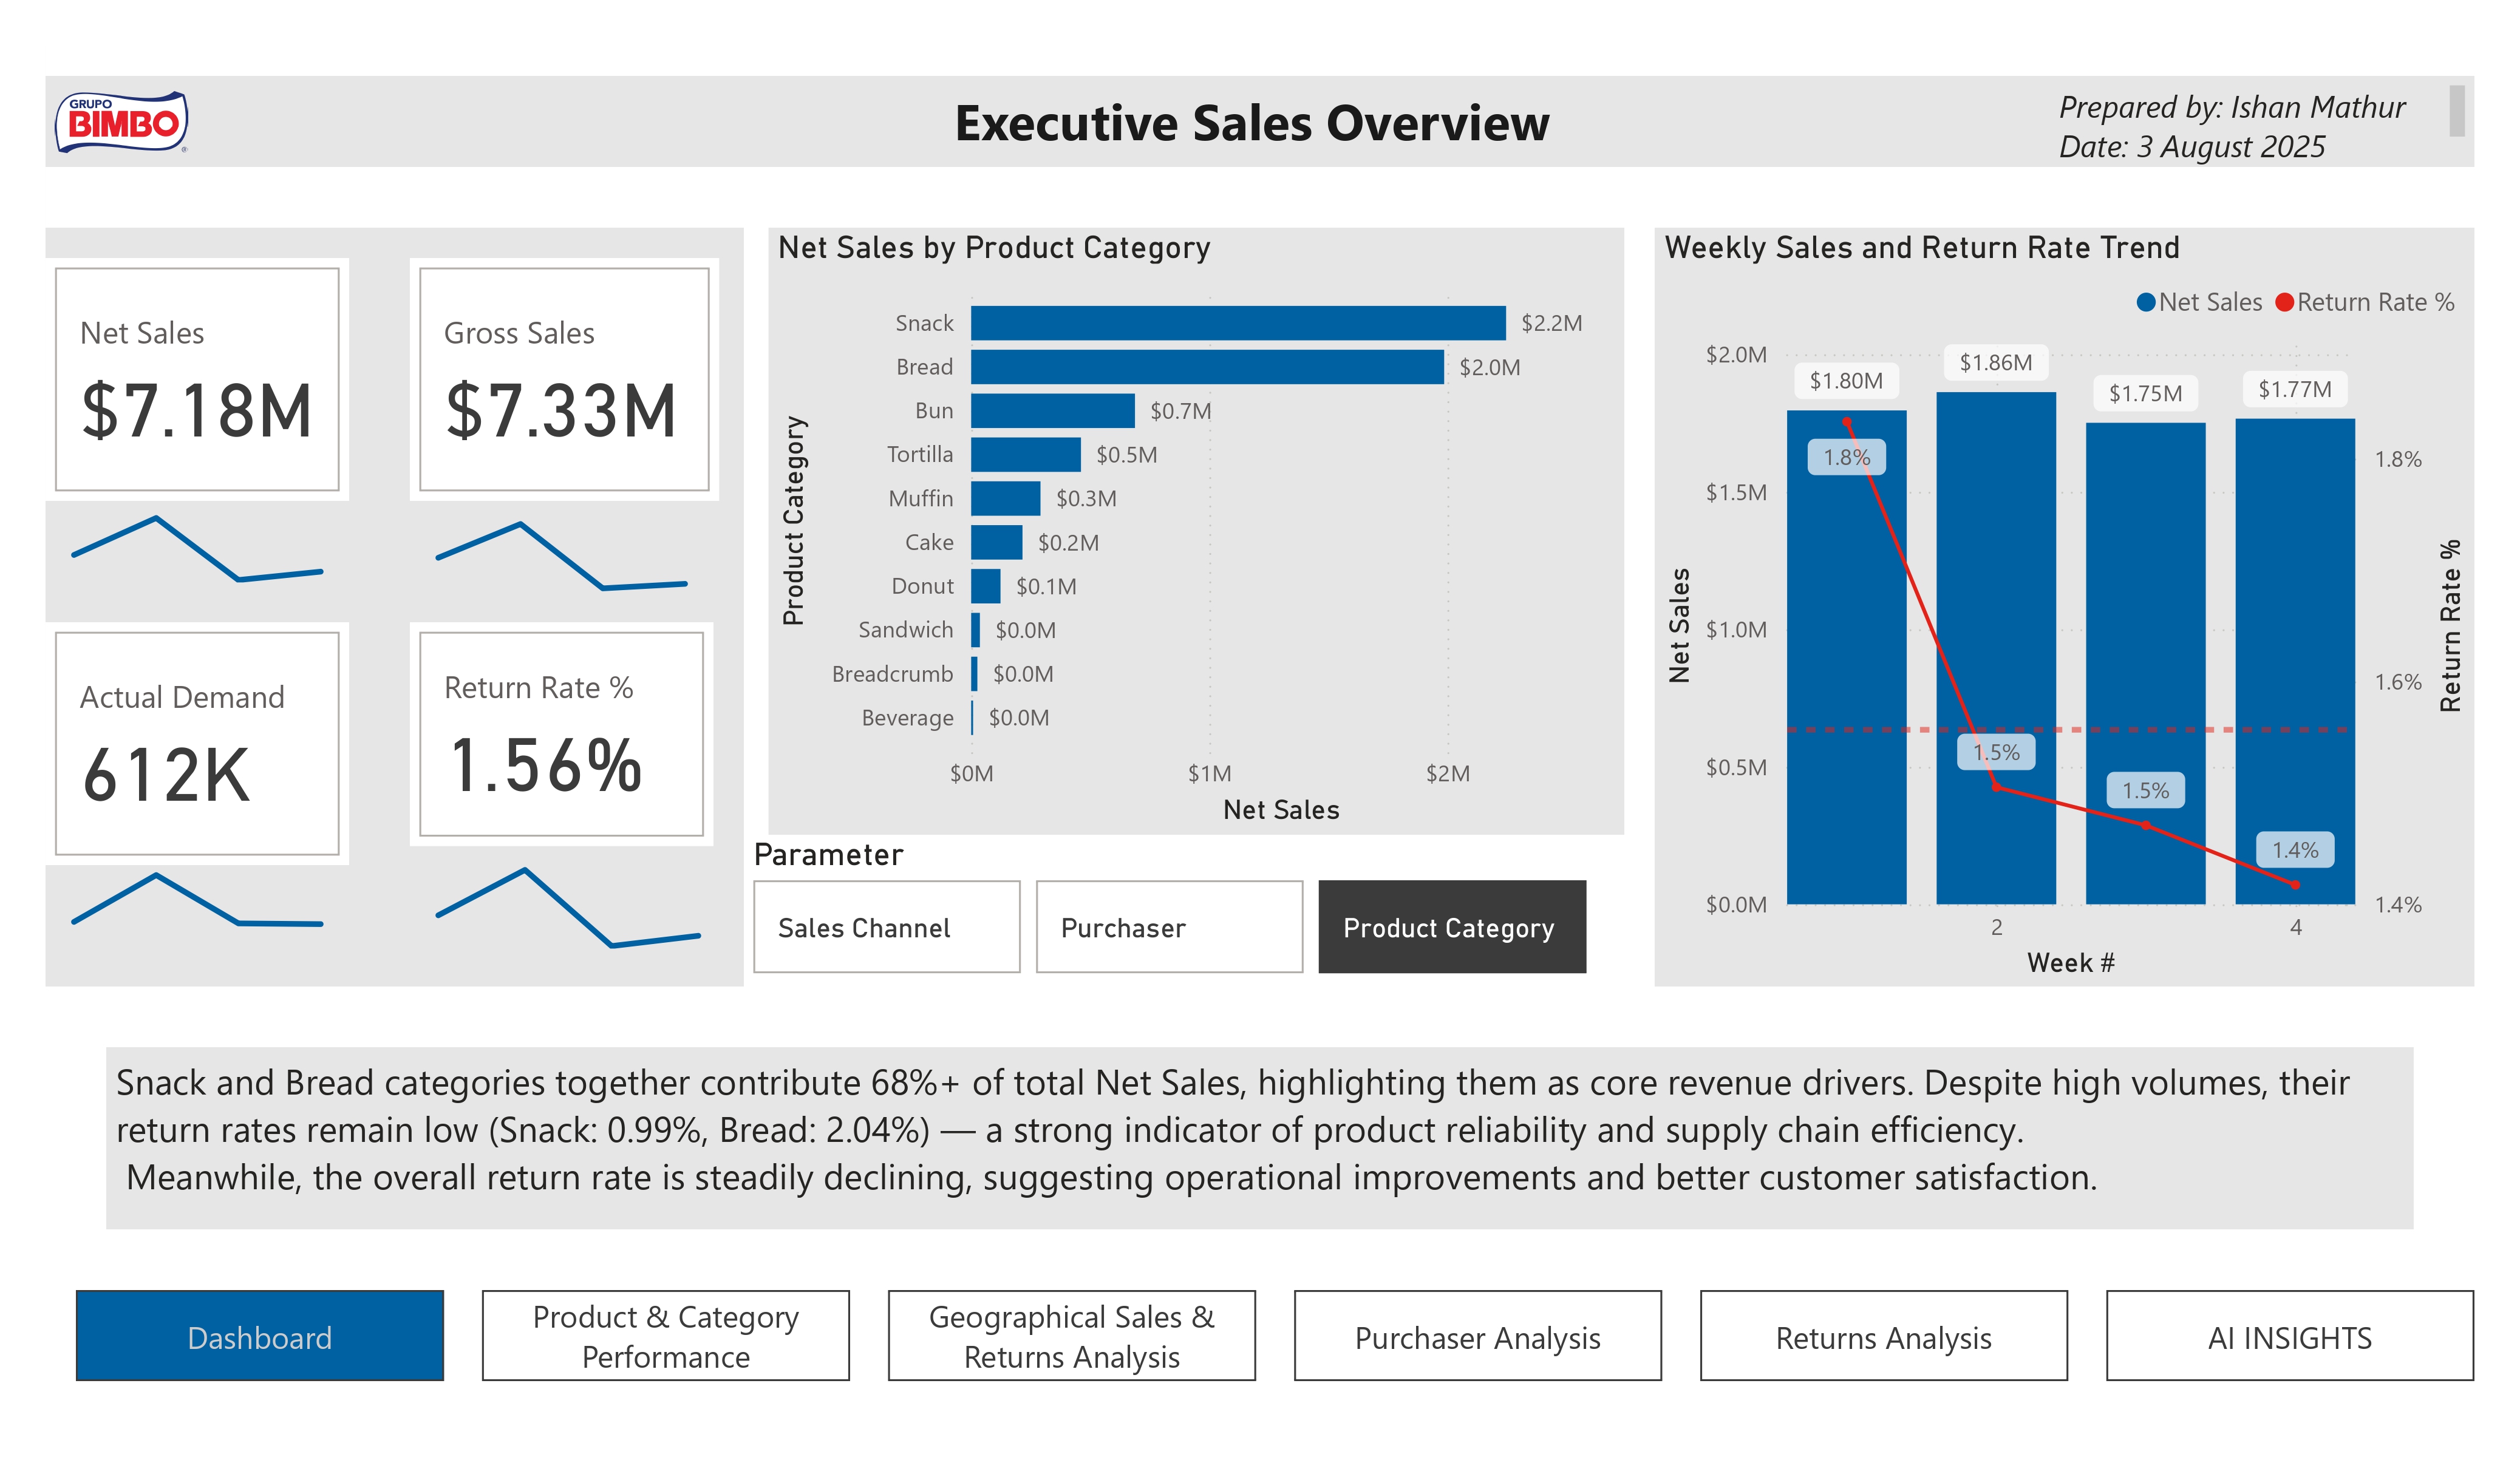
- Executive Summary: High-level KPIs including Net Sales, Return Rate %, and Gross Margin.
- Geospatial Analysis: Interactive map visualizing sales hotspots and return anomalies by region.
- Customer Segmentation: Cohort analysis to track purchasing behavior and lifetime value.
- AI Insights: Key Influencers visual to determine drivers of high return rates.
Technical Implementation
The data model was built using a Star Schema architecture, optimizing query performance for over 1 million rows. DAX measures were implemented for time-intelligence calculations (YTD, YoY) and dynamic segmentation.
Tools Used
- Power BI: Visualization & Modeling
- DAX: Advanced Calculations
- Power Query: ETL & Data Cleaning
- SQL: Data Extraction
Dashboard Screenshots
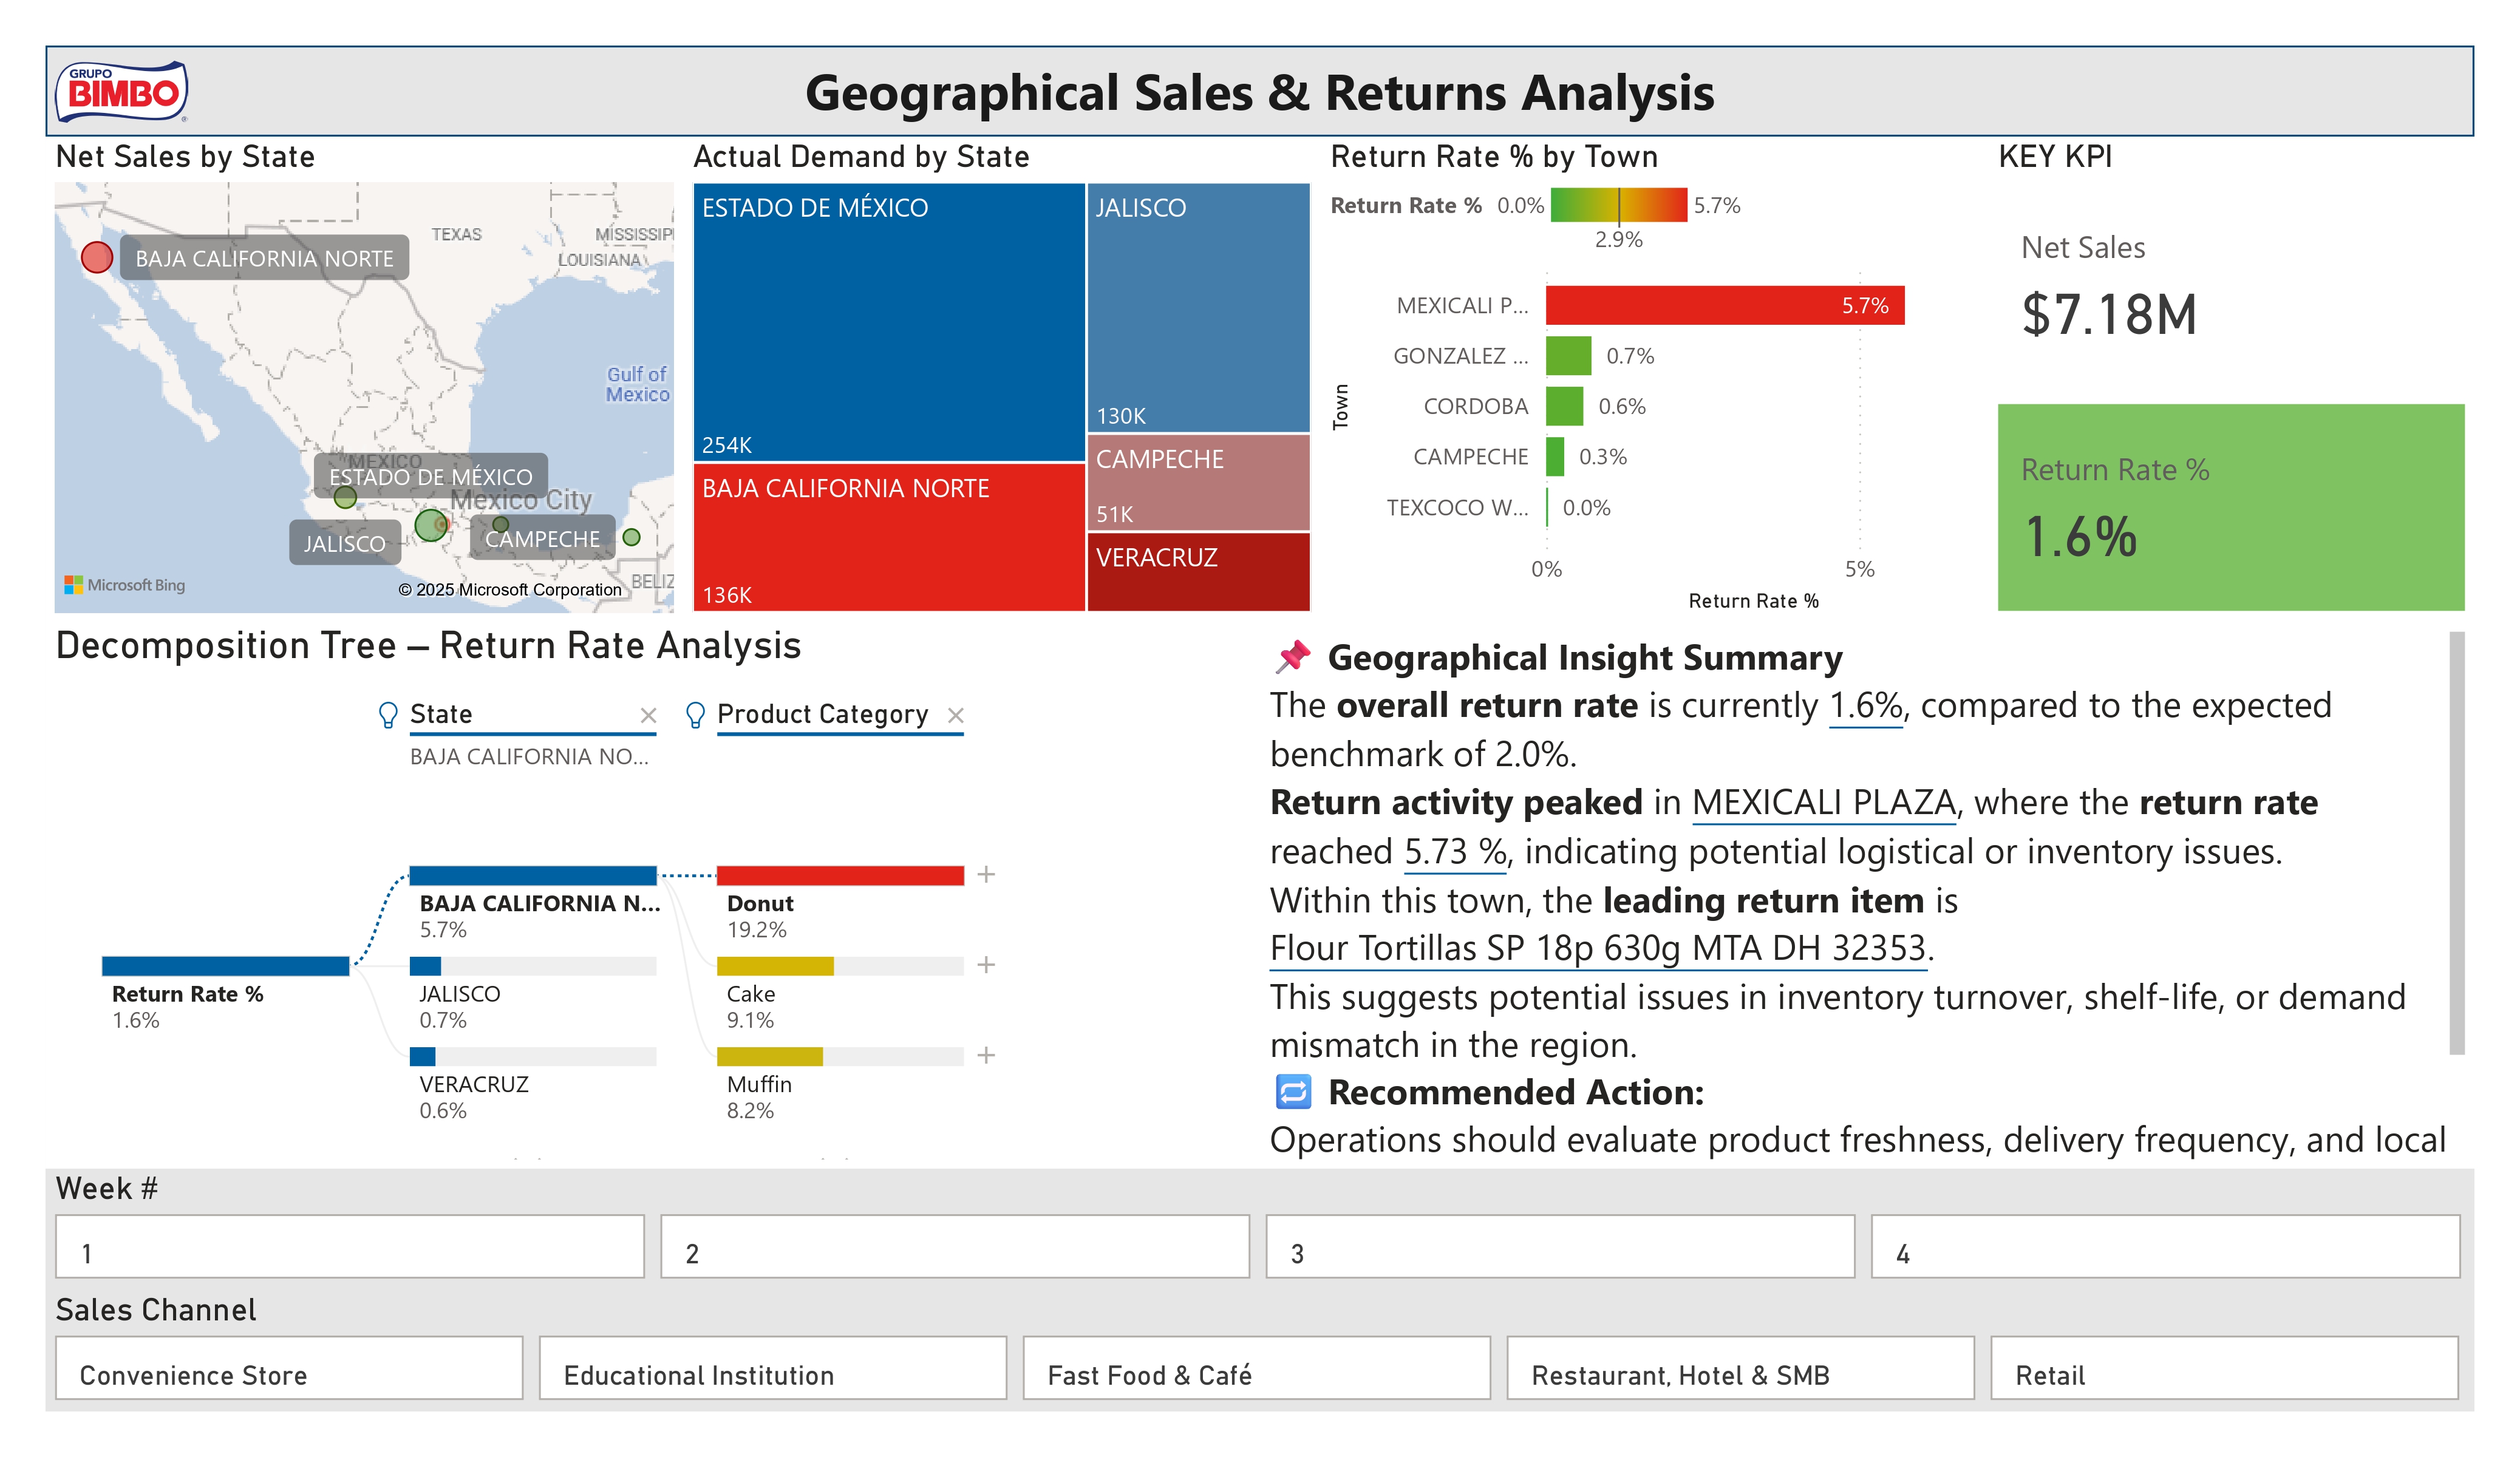
Geographical Analysis - Regional sales performance and return patterns
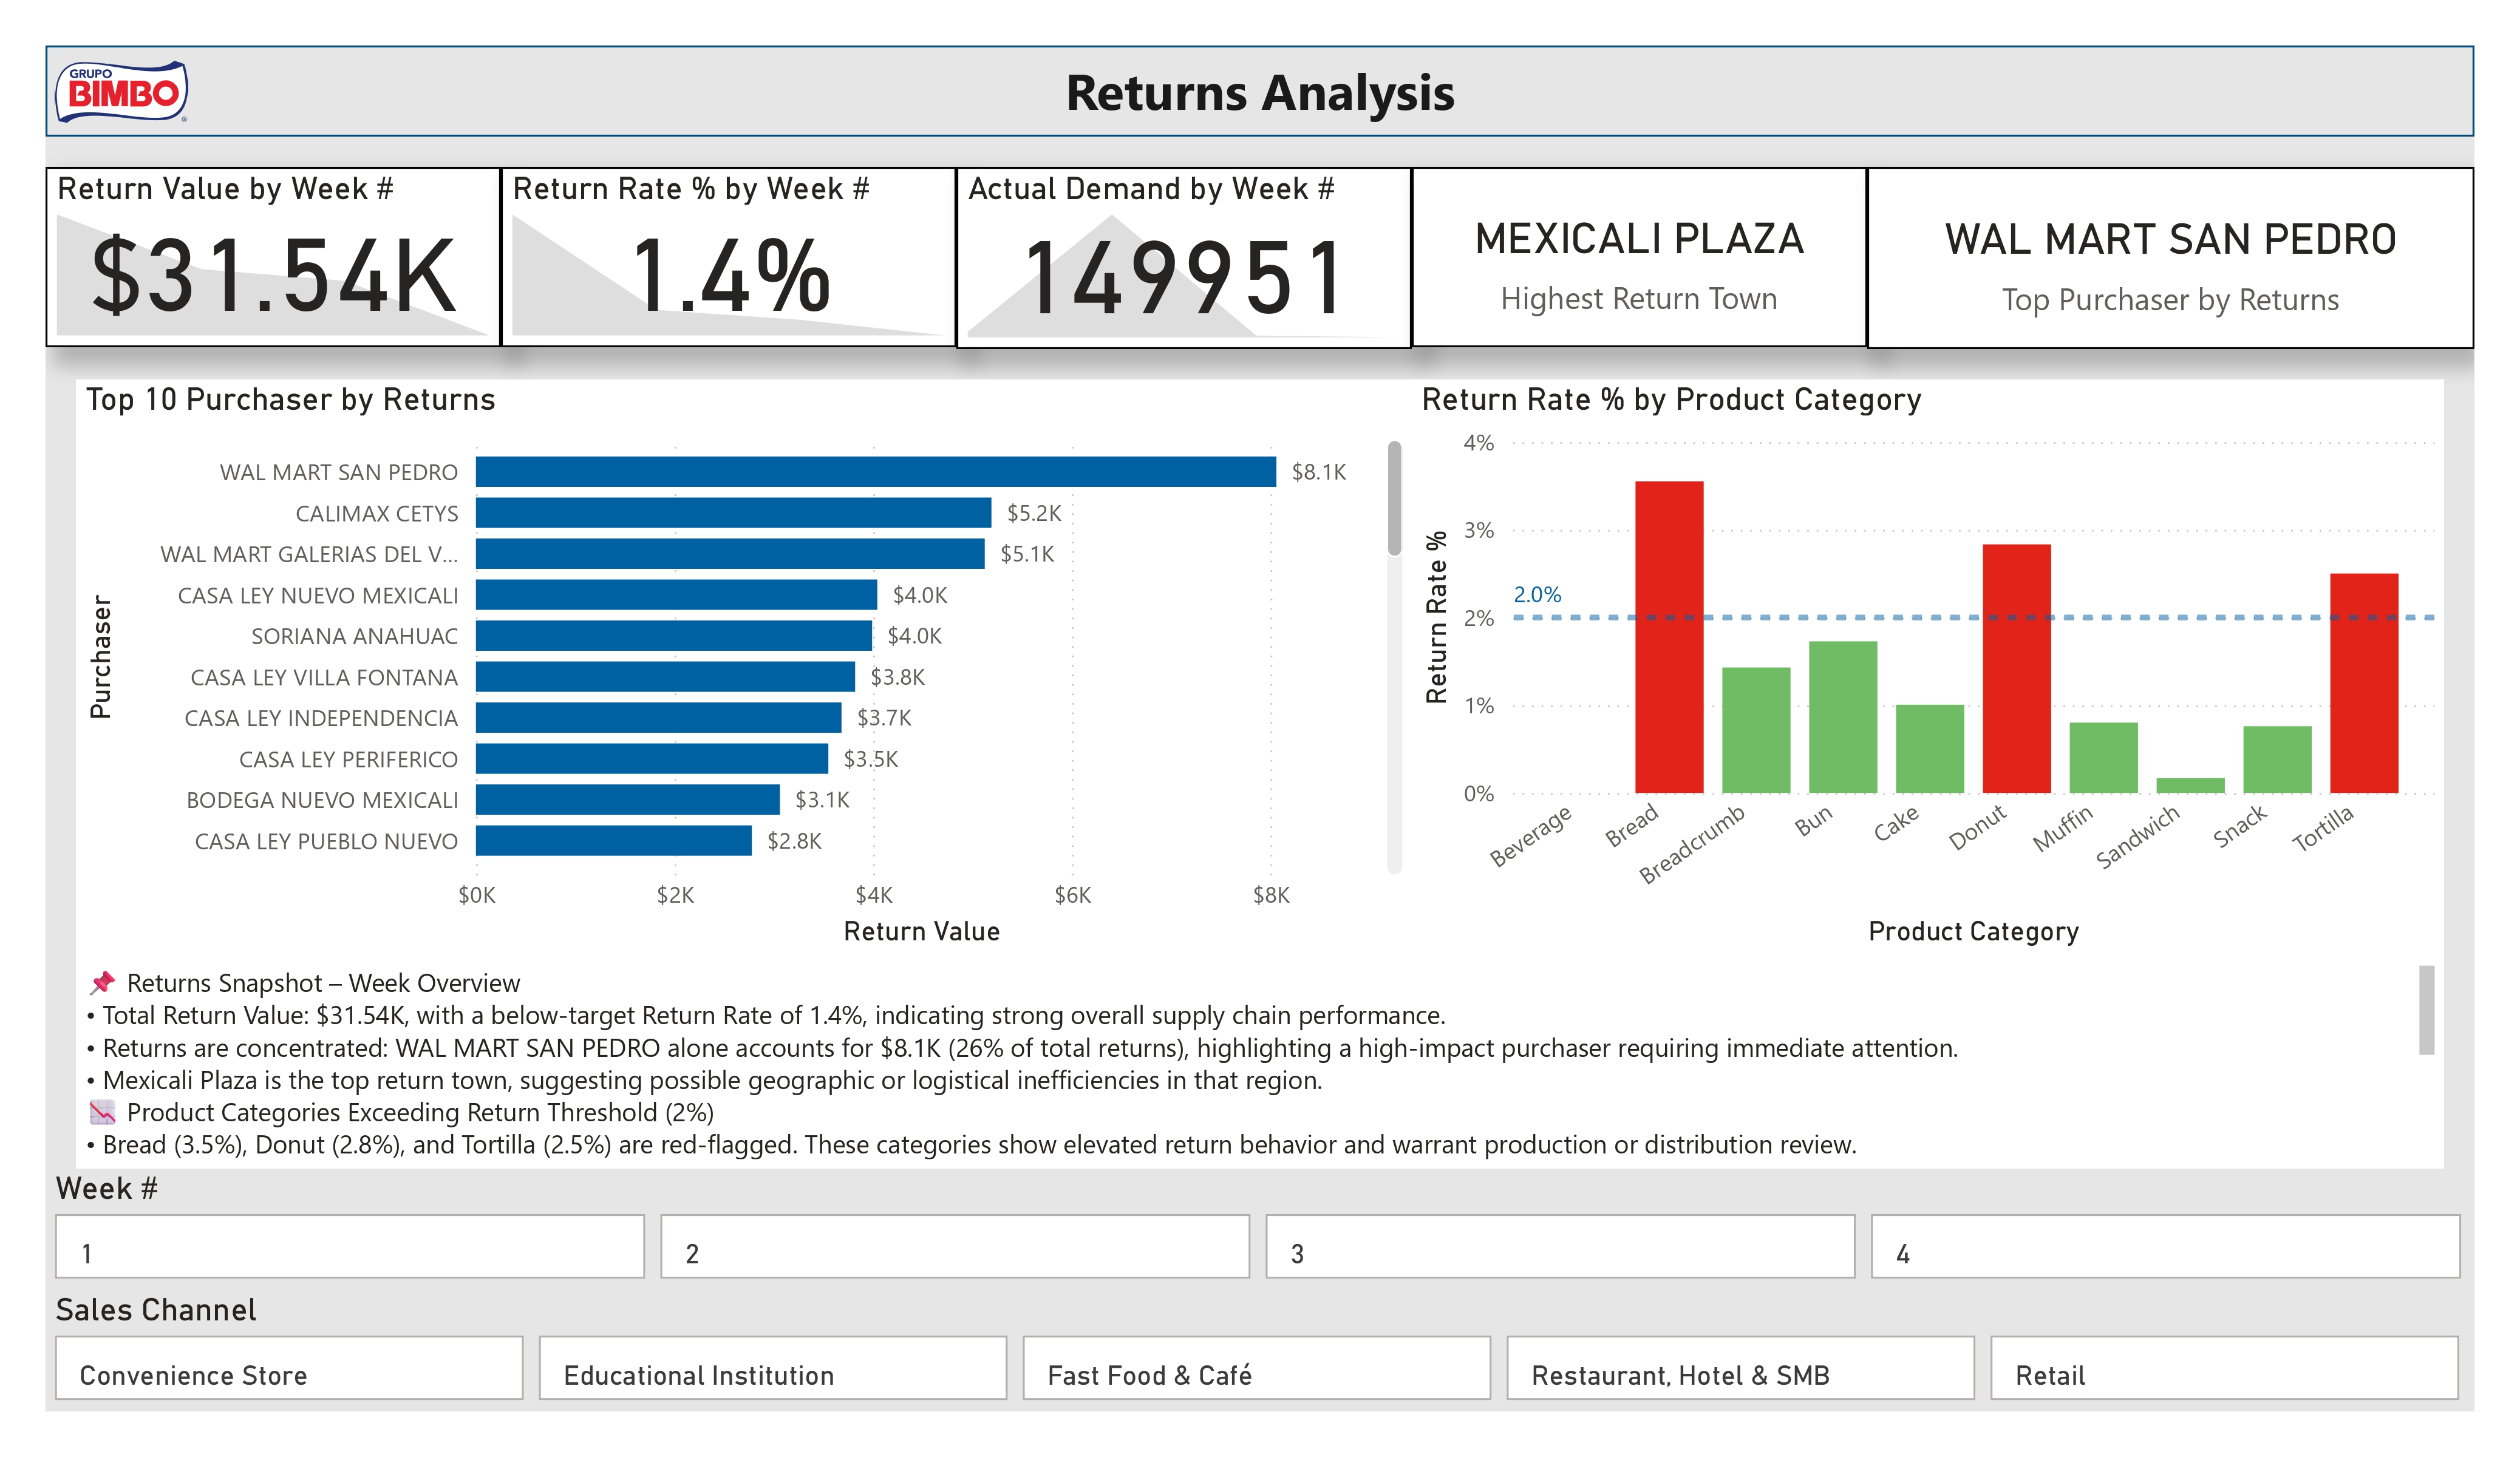
Returns Analysis - Detailed breakdown of return rates and reasons
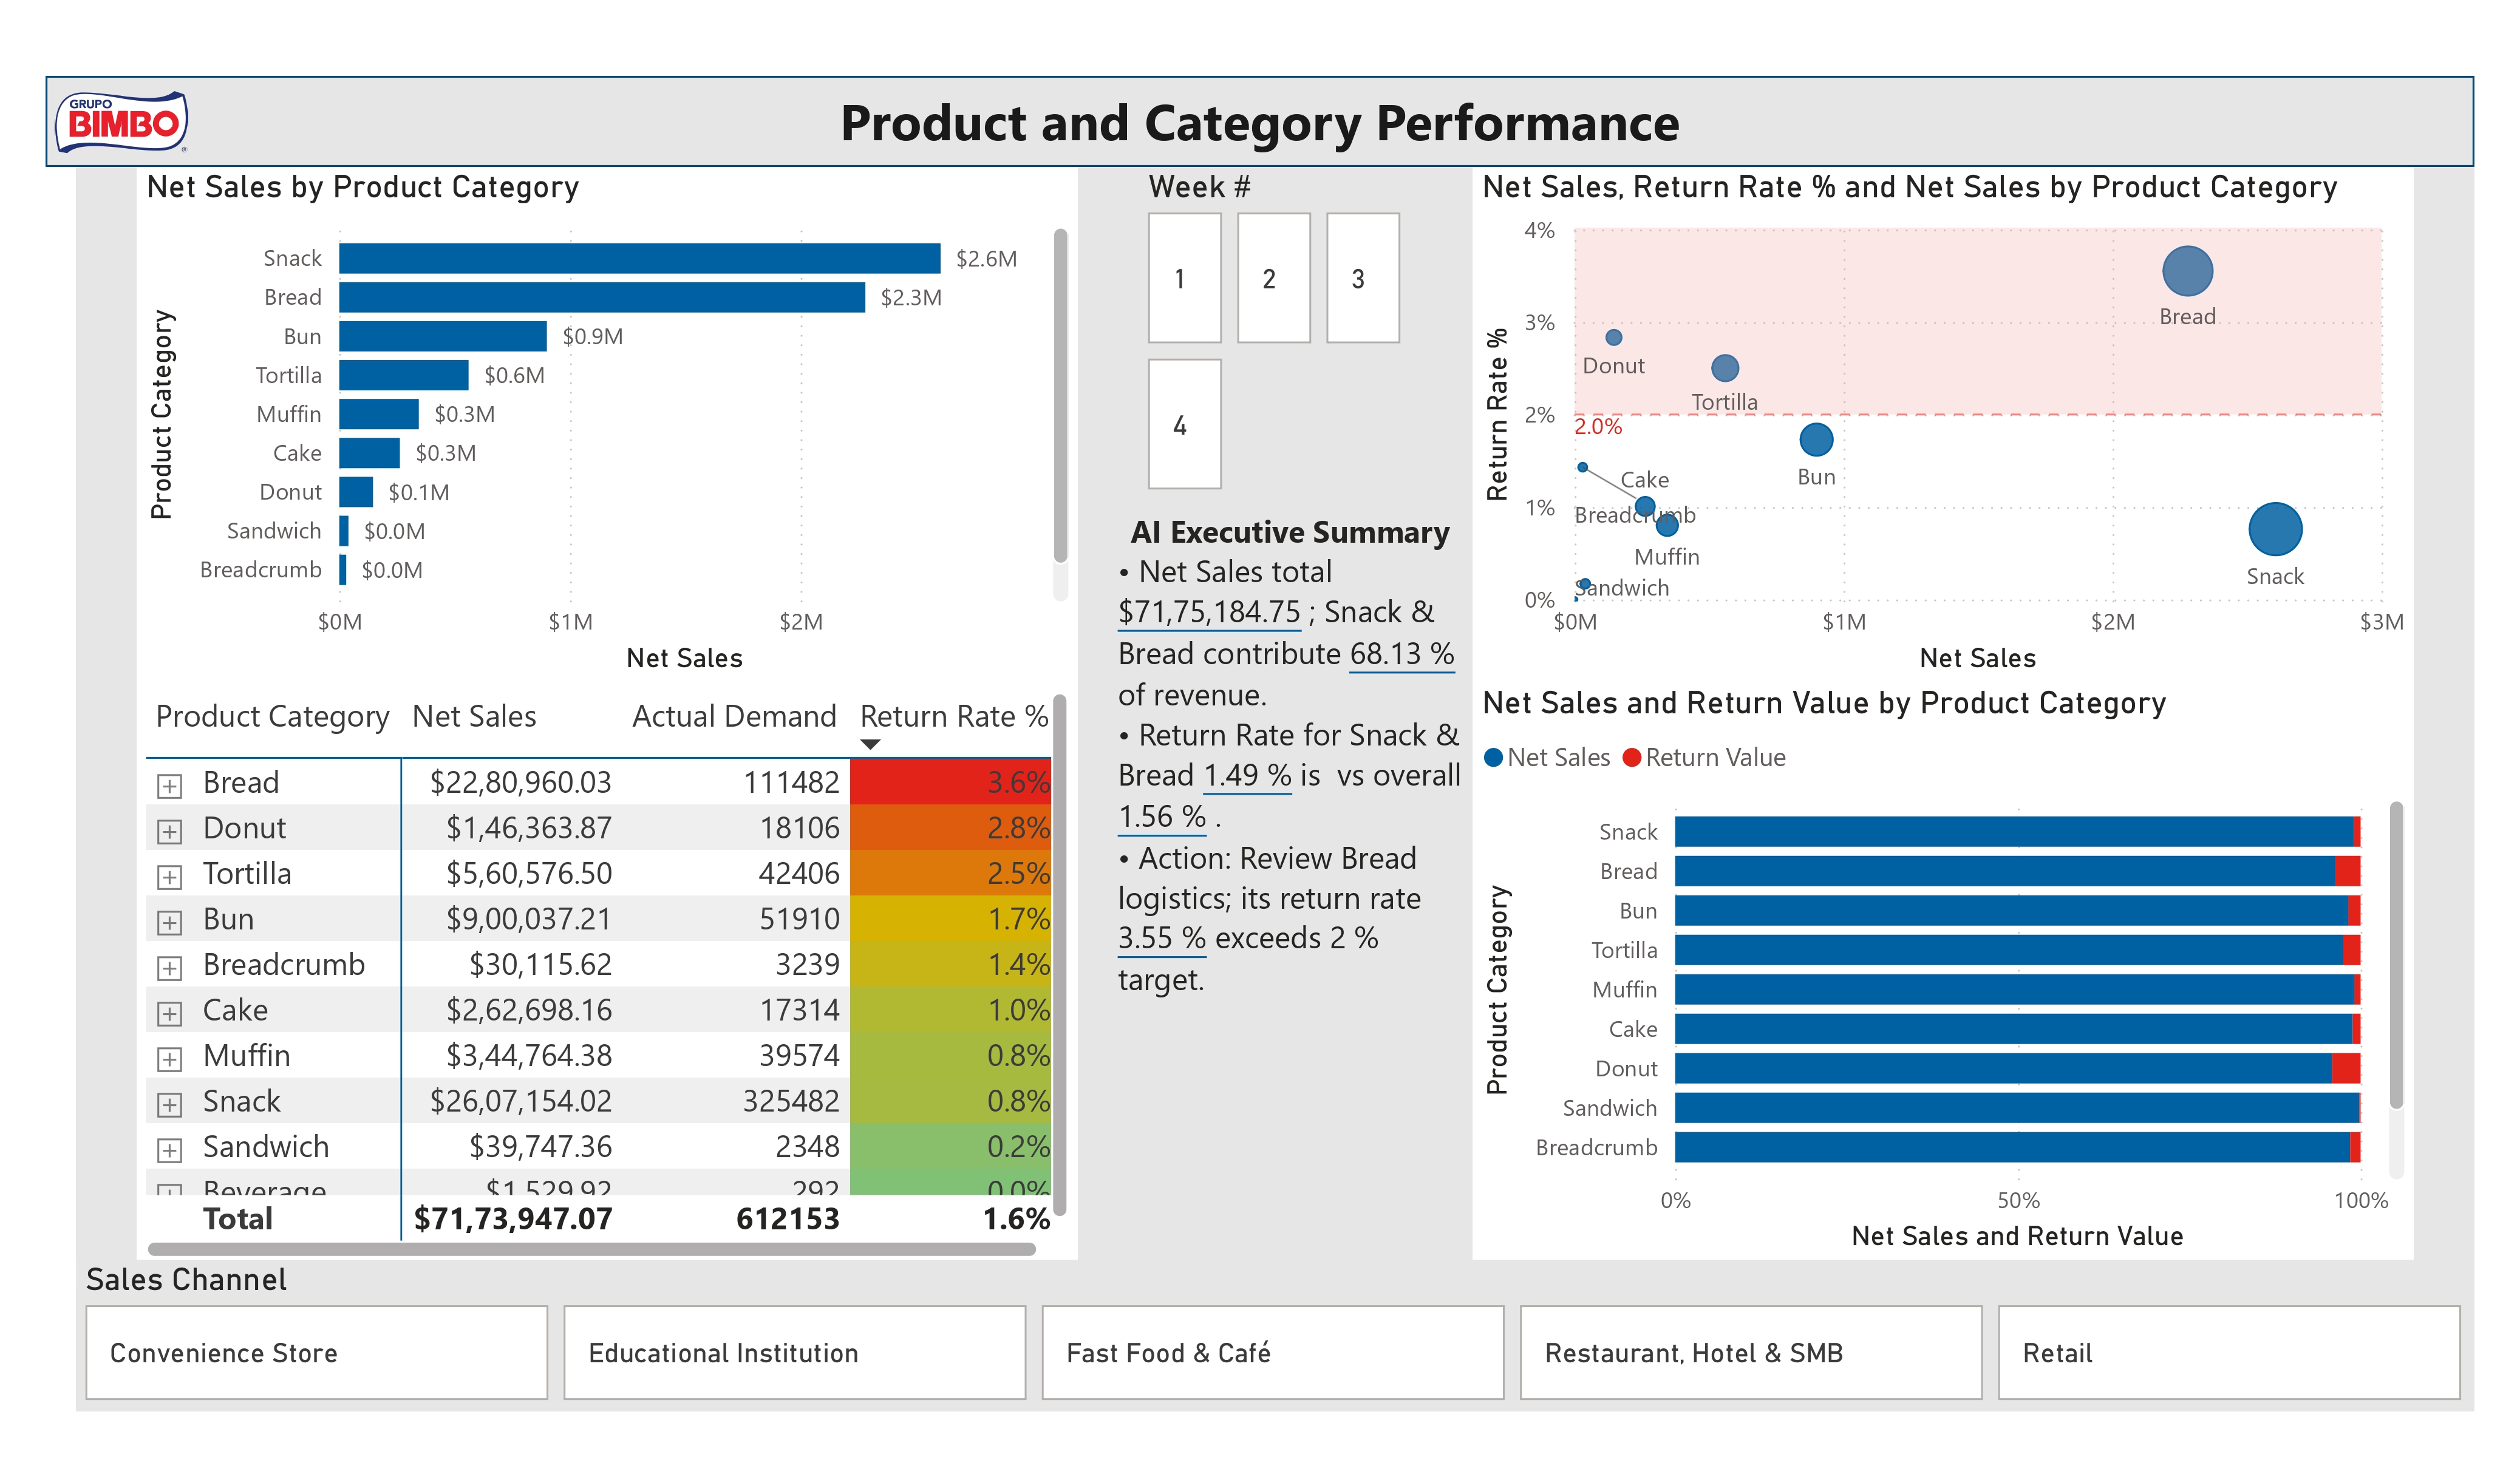
Product Category Performance - Sales and margin analysis by category
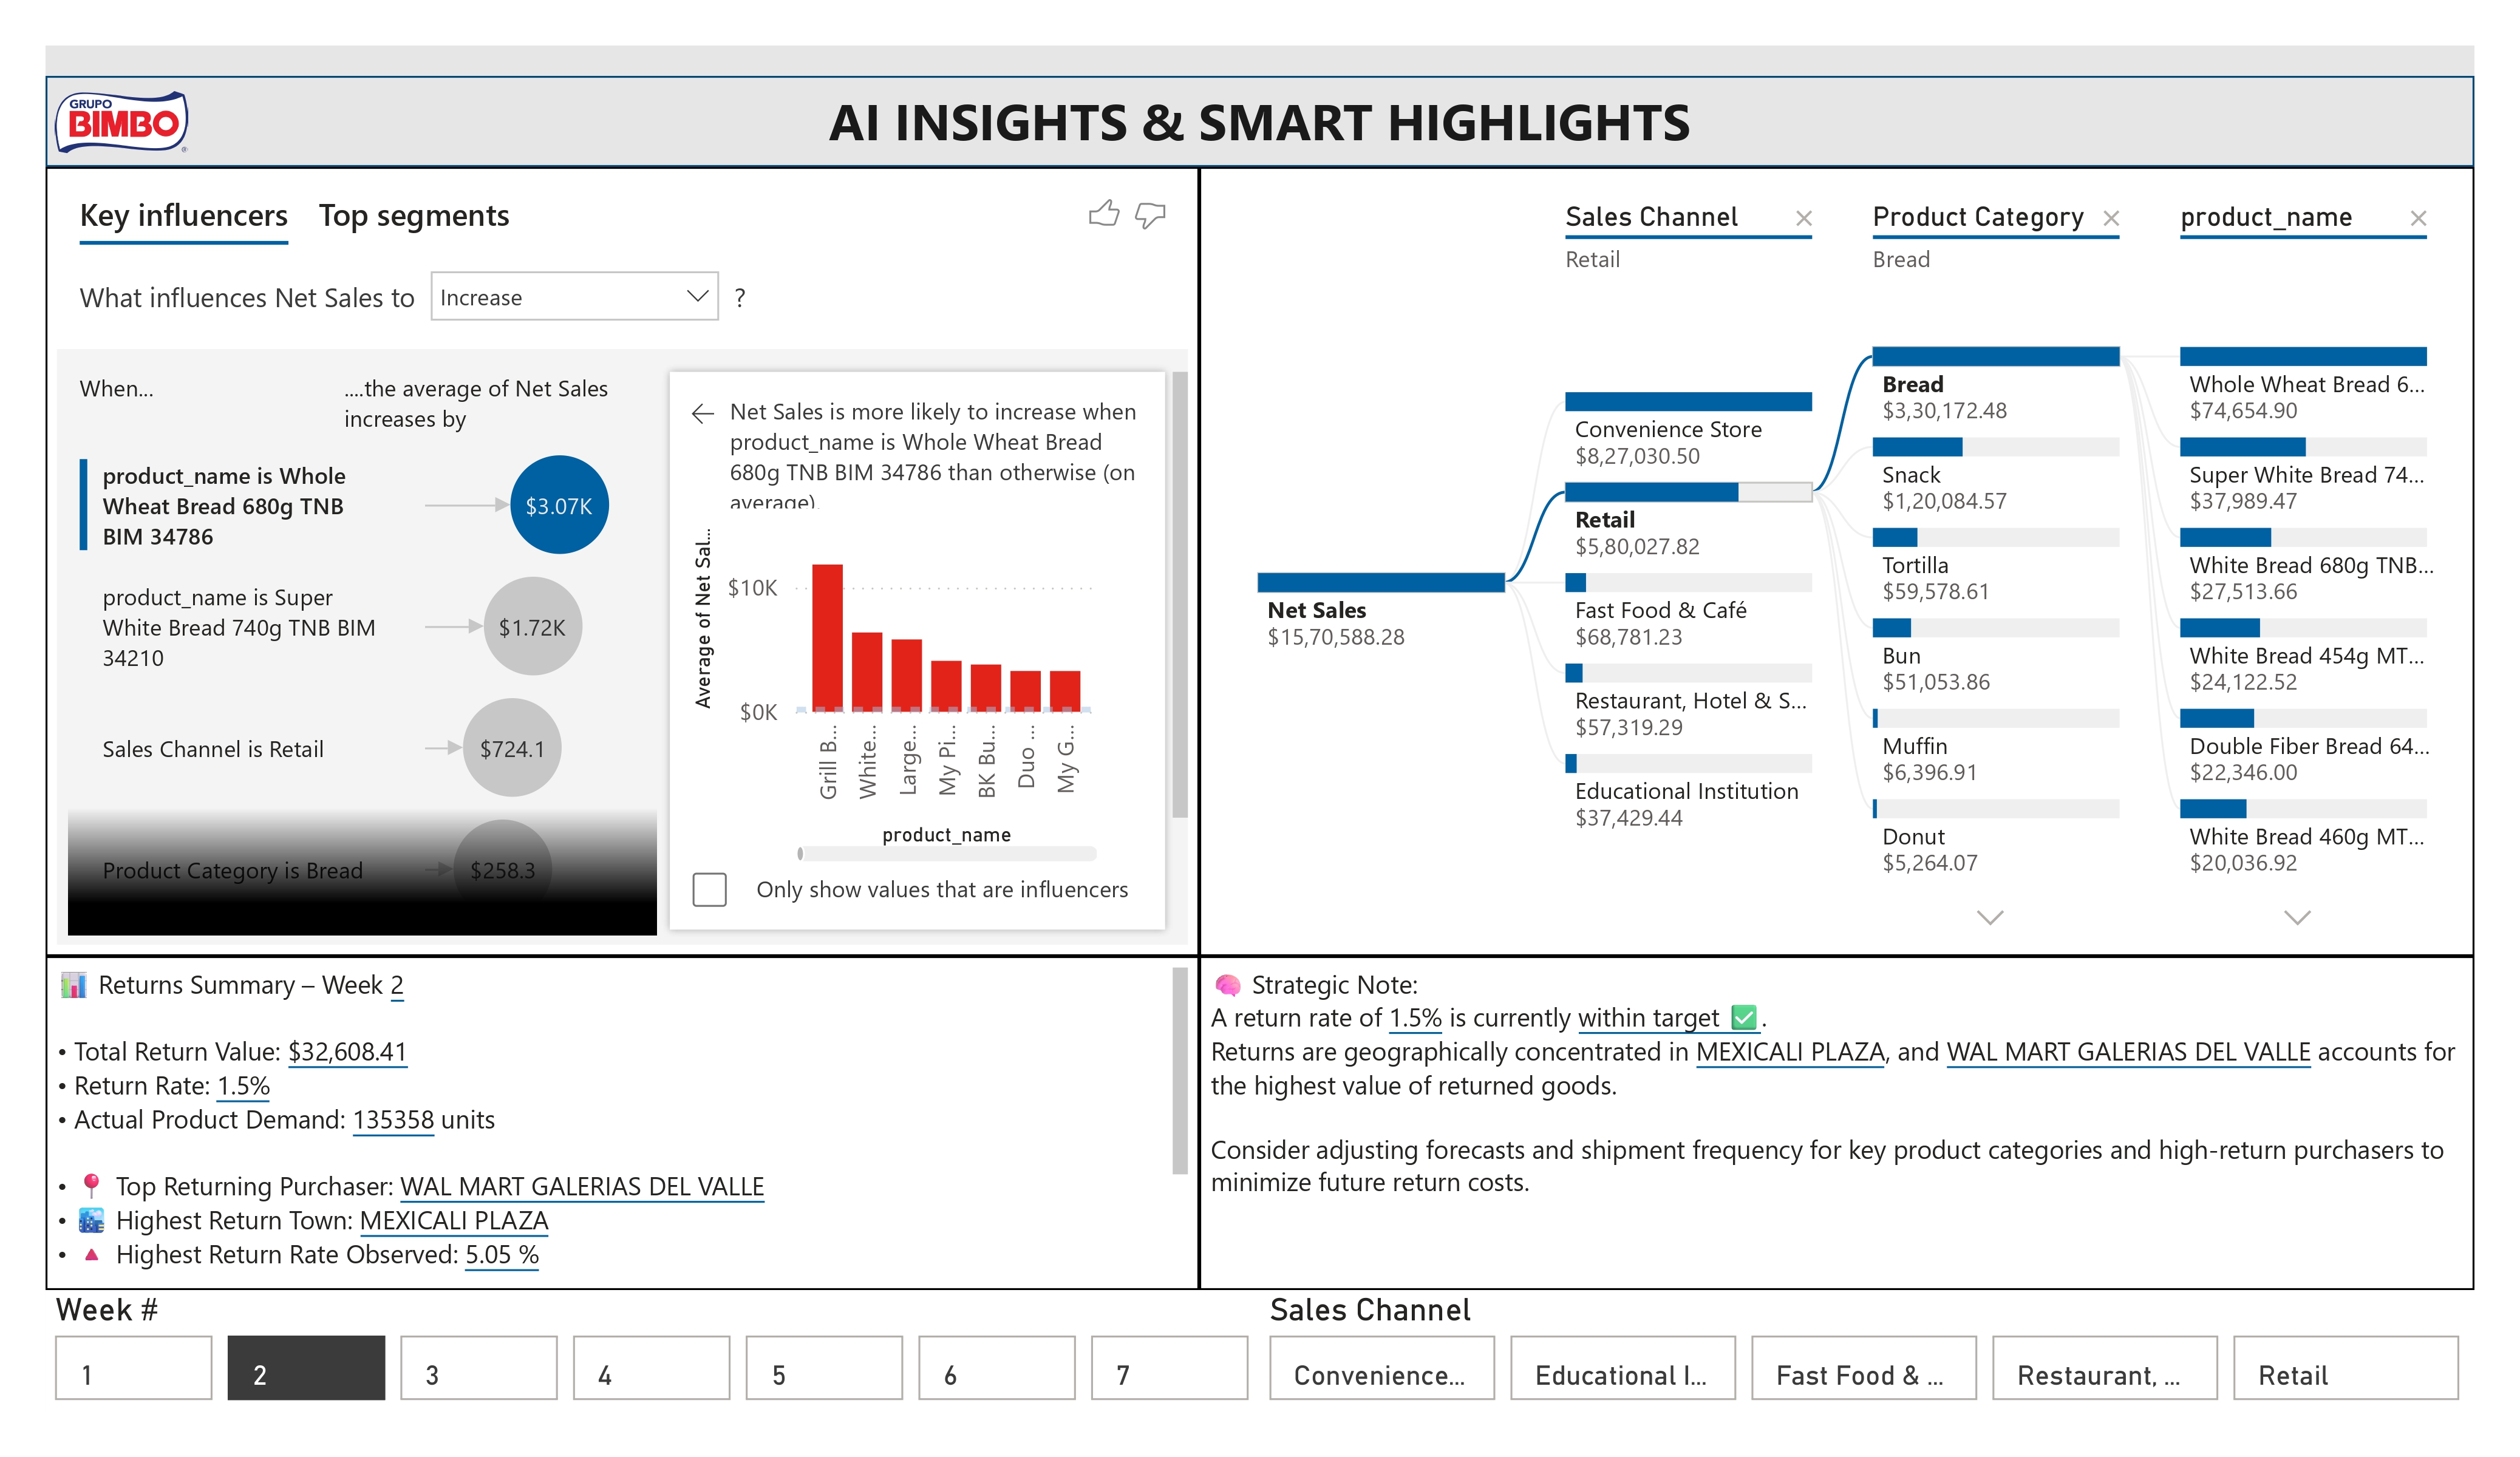
AI Insights - Key influencers and predictive analytics